BIRT Reporting with Spring Boot
Last updated: February 20, 2026

Mocking is an essential part of unit testing, and the Mockito library makes it easy to write clean and intuitive unit tests for your Java code.
Get started with mocking and improve your application tests using our Mockito guide:
Handling concurrency in an application can be a tricky process with many potential pitfalls. A solid grasp of the fundamentals will go a long way to help minimize these issues.
Get started with understanding multi-threaded applications with our Java Concurrency guide:
Spring 5 added support for reactive programming with the Spring WebFlux module, which has been improved upon ever since. Get started with the Reactor project basics and reactive programming in Spring Boot:
Since its introduction in Java 8, the Stream API has become a staple of Java development. The basic operations like iterating, filtering, mapping sequences of elements are deceptively simple to use.
But these can also be overused and fall into some common pitfalls.
To get a better understanding on how Streams work and how to combine them with other language features, check out our guide to Java Streams:
Explore Spring Boot 3 and Spring 6 in-depth through building a full REST API with the framework:
Yes, Spring Security can be complex, from the more advanced functionality within the Core to the deep OAuth support in the framework.
I built the security material as two full courses - Core and OAuth, to get practical with these more complex scenarios. We explore when and how to use each feature and code through it on the backing project.
You can explore the course here:
Spring Data JPA is a great way to handle the complexity of JPA with the powerful simplicity of Spring Boot.
Get started with Spring Data JPA through the guided reference course:
Refactor Java code safely — and automatically — with OpenRewrite.
Refactoring big codebases by hand is slow, risky, and easy to put off. That’s where OpenRewrite comes in. The open-source framework for large-scale, automated code transformations helps teams modernize safely and consistently.
Each month, the creators and maintainers of OpenRewrite at Moderne run live, hands-on training sessions — one for newcomers and one for experienced users. You’ll see how recipes work, how to apply them across projects, and how to modernize code with confidence.
Join the next session, bring your questions, and learn how to automate the kind of work that usually eats your sprint time.
Yes, we're now running our only Summer Sale. All Courses are 30% off until 20th July, 2026:
Yes, we're now running our only Summer Sale. All Courses are 30% off until 20th July, 2026:
1. Introduction
In this tutorial, we’re going to integrate BIRT (Business Intelligence and Reporting Tools) with Spring Boot MVC, to serve static and dynamic reports in HTML and PDF format.
2. What Is BIRT?
BIRT is an open source engine to create data visualizations that can be integrated into Java web applications.
It’s a top-level software project within the Eclipse Foundation and leverages contributions by IBM and Innovent Solutions. It was started and sponsored by Actuate at the end of 2004.
The framework allows creating reports integrated with a wide range of data sources.
3. Maven Dependencies
BIRT has two main components: a visual report designer to create report design files, and a runtime component for interpreting and rendering those designs.
In our example web application, we’re going to use both on top of Spring Boot.
3.1. BIRT Framework Dependencies
As we’re used to thinking in terms of dependency management, the first choice would be to look for BIRT in Maven Central.
However, the latest official version of the core library available is 4.6 from 2016, while on the Eclipse download page, we can find links for at least two newer versions (the current is 4.8).
If we choose to go for the official build, the easiest way to have the code up and running is to download the BIRT Report Engine package, which is a complete web application also useful for learning. We then need to copy its lib folder into our project (about 68MB in size) and tell the IDE to include all the jars in it.
It goes without saying that, using this approach, we’ll be able to compile only through the IDE, as Maven won’t find those jars unless we configure and install them manually (more than 100 files!) in our local repo.
Fortunately, Innovent Solutions has decided to take matters in its hands and published on Maven Central its own builds of the latest BIRT dependencies, which is great, as it manages for us all the needed dependencies.
Reading through comments in online forums, it’s unclear whether these artifacts are production-ready, but Innovent Solutions worked on the project next to the Eclipse team since the start, so our project relies on them.
Including BIRT is now very easy:
<dependency>
    <groupId>com.innoventsolutions.birt.runtime</groupId>
    <artifactId>org.eclipse.birt.runtime_4.8.0-20180626</artifactId>
    <version>4.8.0</version>
</dependency>
3.2. Spring Boot Dependencies
Now that BIRT is imported into our project, we just need to add the standard Spring Boot dependencies in our pom file.
There’s one pitfall, though, because the BIRT jar contains its own implementation of Slf4J, which doesn’t play nice with Logback and throws a conflict exception during startup.
As we can’t remove it from the jar, in order to fix this problem, we need to exclude Logback:
<dependency>
    <groupId>org.springframework.boot</groupId>
    <artifactId>spring-boot-starter-logging</artifactId>
    <exclusions>
        <exclusion>
            <groupId>ch.qos.logback</groupId>
            <artifactId>logback-classic</artifactId>
        </exclusion>
    </exclusions>
</dependency>
Now we’re finally ready to start!
4. BIRT Reports
In the BIRT framework, a report is a long XML configuration file, identified by the extension rptdesign.
It tells the Engine what to draw and where, from the style of a title up to the required properties to connect to a data source.
For a basic dynamic report, we need to configure three things:
- the data source (in our example we use a local CSV file, but it could easily be a database table)
- the elements we want to display (charts, tables, etc)
- the page design
The report is structured like an HTML page, with header, body, footer, scripts, and styles.
The framework provides an extensive set of components to choose from out-of-the-box, including integration to mainstream data sources, layouts, charts, and tables. And, we can extend it to add our own!
There are two ways to generate a report file: visual or programmatic.
5. The Eclipse Report Designer
To ease the creation of reports, the Eclipse team built a report design tool plugin for its popular IDE.
This tool features an easy drag & drop interface from the Palette on the left, which automatically opens the setup window for the new component we add to the page. We can also see the all customizations available for each component by clicking on it on the page and then on the Property Editor button (highlighted in the image below).
To visualize the entire page structure in a tree view, we just need to click on the Outline button.
The Data Explorer tab also contains the data sources defined for our report:
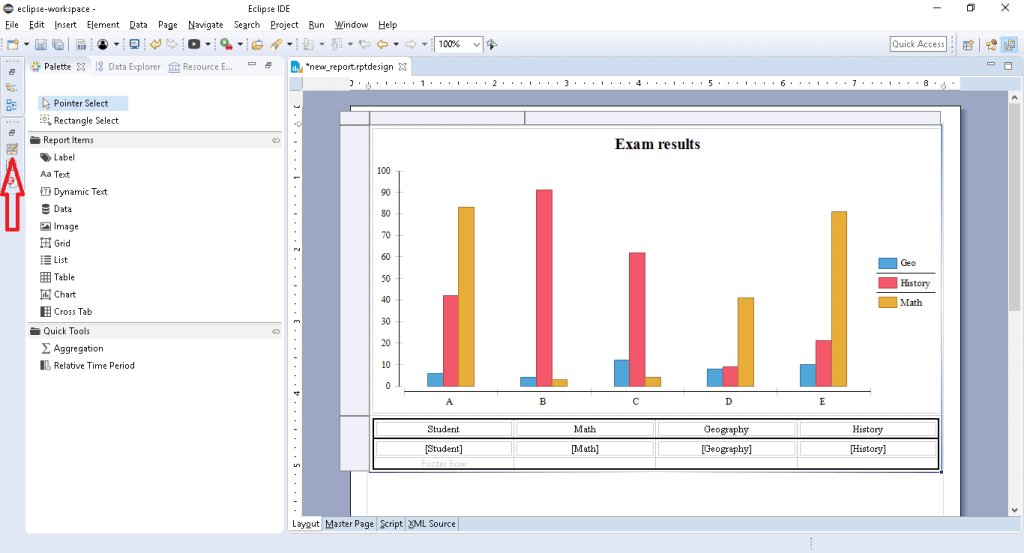
The sample report displayed in the image can be found at the path <project_root>/reports/csv_data_report.rptdesign
Another advantage of going for the visual designer is the online documentation, which focuses more on this tool instead of the programmatic approach.
If we’re already using Eclipse, we just need to install the BIRT Report Design plugin, which includes a predefined perspective and the visual editor.
For those developers who are not currently using Eclipse and don’t want to switch, there’s an Eclipse Report Designer package, which consists of a portable Eclipse installation with the BIRT plugin pre-installed.
Once the report file is finalized, we can save it in our project and go back to coding in our preferred environment.
6. The Programmatic Approach
We can also design a report using only code, but this approach is a lot harder due to the poor documentation available, so be prepared to dig into source code and online forums.
Also worth considering is that all the tedious design details like size, length, and grid position are a lot easier to deal with using the designer.
To prove this point, here’s an example of how to define a simple static page with an image and a text:
DesignElementHandle element = factory.newSimpleMasterPage("Page Master");
design.getMasterPages().add(element);

GridHandle grid = factory.newGridItem(null, 2, 1);
design.getBody().add(grid);

grid.setWidth("100%");

RowHandle row0 = (RowHandle) grid.getRows().get(0);

ImageHandle image = factory.newImage(null);
CellHandle cell = (CellHandle) row0.getCells().get(0);
cell.getContent().add(image);
image.setURL("\"https://www.baeldung.com/wp-content/themes/baeldung/favicon/favicon-96x96.png\"");

LabelHandle label = factory.newLabel(null);
cell = (CellHandle) row0.getCells().get(1);
cell.getContent().add(label);
label.setText("Hello, Baeldung world!");
This code will generate a simple (and ugly) report:

The sample report displayed in the image above can be found at this path: <project_root>/reports/static_report.rptdesign.
Once we’ve coded how the report should look and what data it should display, we can generate the XML file by running our ReportDesignApplication class.
7. Attaching a Data Source
We mentioned earlier that BIRT supports many different data sources.
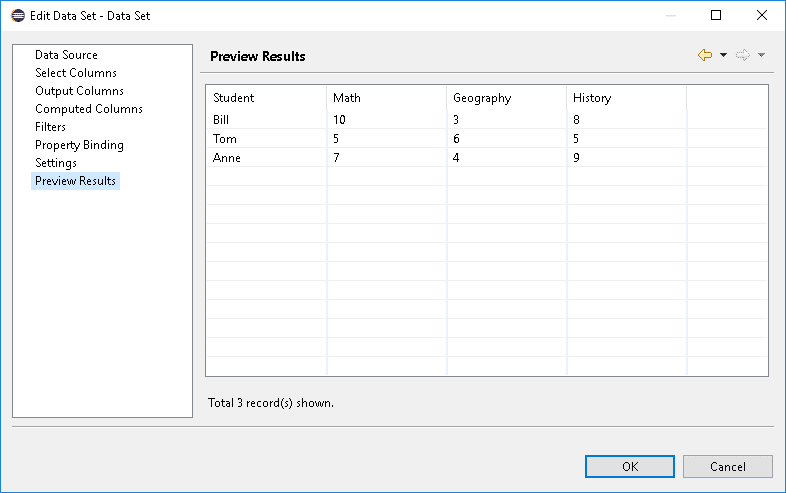
For our example project, we used a simple CSV file with three entries. It can be found in the reports folder and consists of three simple rows of data, plus headers:
Student, Math, Geography, History
Bill, 10,3,8
Tom, 5,6,5
Anne, 7, 4,9
7.1. Configuring the Data Source
To let BIRT use our file (or any other type of source), we have to configure a Data Source.
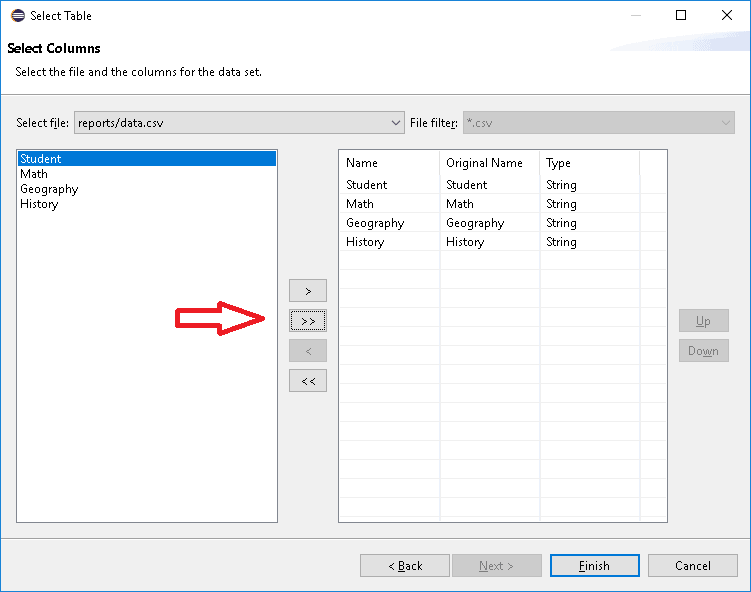
For our file, we created a Flat File Data Source with the report designer, all in just a few steps:
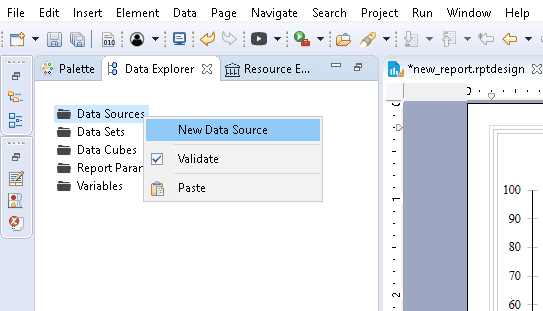
- Open the designer perspective and look at the outline on the right.
- Right-click on the Data Sources icon.
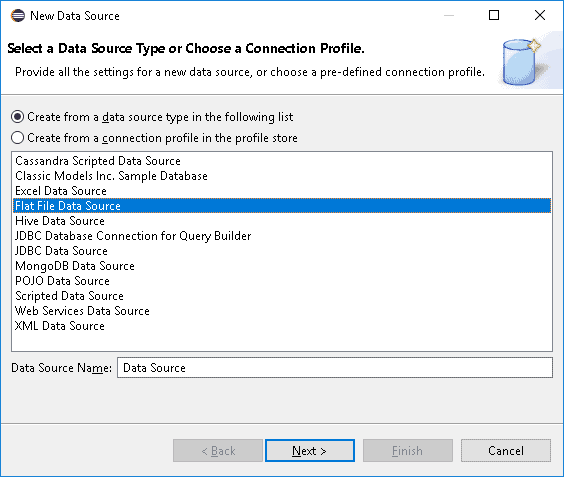
- Select the desired source type (in our case the flat file source).
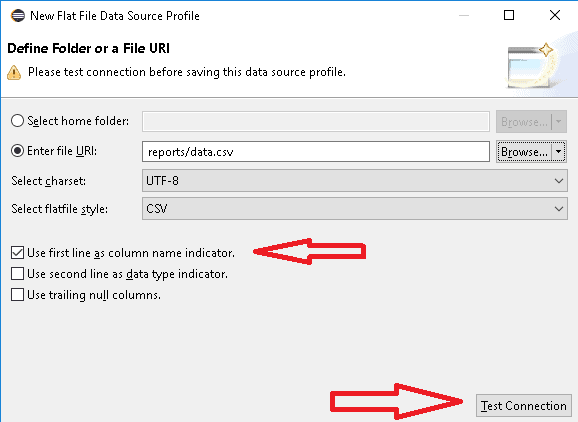
- We can now choose either to load an entire folder or just one file. We used the second option (if our data file is in CSV format, we want to make sure to use the first line as column name indicator).
- Test the connection to make sure the path is correct.
We attached some pictures to show each step:

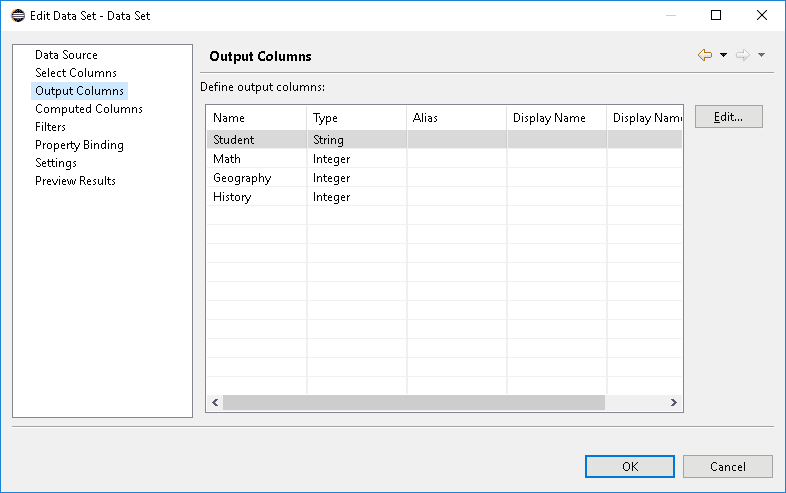
7.2. The Data Set
The data source is ready, but we still need to define our Data Set, which is the actual data shown in our report:
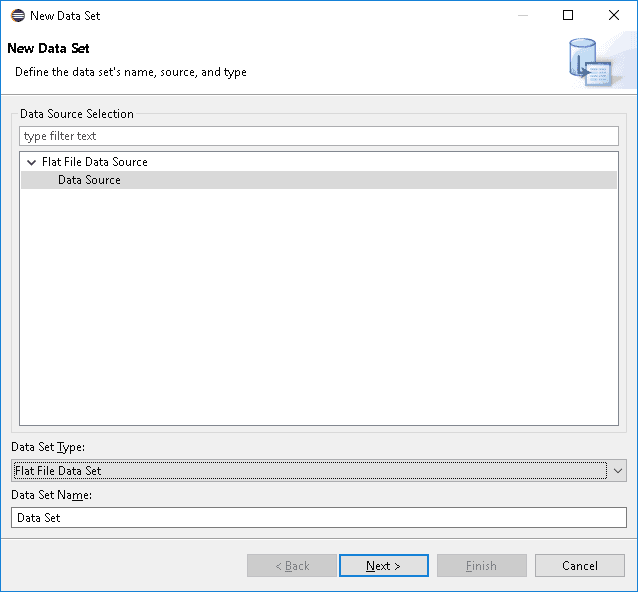
- Open the designer perspective and look at the outline on the right.
- Right-click on the Data Sets icon.
- Select the desired Data Source and the type (in our case there’s only one type).
- The next screen depends on the type of data source and data set we’re selected: in our case, we see a page where we can select the columns to include.
- Once the setup is complete, we can open the configuration at any time by double-clicking on our data set.
- In Output Columns, we can set the right type of the data displayed.
- We can then look at a preview by clicking on Preview Results.
Again, some pictures to clarify these steps:
7.3. Other Data Source Types
As mentioned in step 4 of the Data Set configuration, the options available may change depending on the Data Source referred.
For our CSV file, BIRT gives options related to which columns to show, the data type, and if we want to load the entire file. On the other hand, if we had a JDBC data source, we may have to write an SQL query or a stored procedure.
From the Data Sets menu, we can also join two or more data sets in a new data set.
8. Rendering the Report
Once the report file is ready, we have to pass it to the engine for rendering. To do this, there are a few things to implement.
8.1. Initializing the Engine
The ReportEngine class, which interprets the design files and generates the final result, is part of the BIRT runtime library.
It uses a bunch of helpers and tasks to do the job, making it quite resource-intensive:

Image source: Eclipse BIRT documentation
There is a significant cost associated with creating an engine instance, due primarily to the cost of loading extensions. Therefore, we should create just one ReportEngine instance and use it to run multiple reports.
The report engine is created through a factory supplied by the Platform. Before creating the engine, we have to start the Platform, which will load the appropriate plug-ins:
@PostConstruct
protected void initialize() throws BirtException {
    EngineConfig config = new EngineConfig();
    config.getAppContext().put("spring", this.context);
    Platform.startup(config);
    IReportEngineFactory factory = (IReportEngineFactory) Platform
      .createFactoryObject(IReportEngineFactory.EXTENSION_REPORT_ENGINE_FACTORY);
    birtEngine = factory.createReportEngine(config);
    imageFolder = System.getProperty("user.dir") + File.separatorChar + reportsPath + imagesPath;
    loadReports();
}
When we don’t need it anymore, we can destroy it:
@Override
public void destroy() {
    birtEngine.destroy();
    Platform.shutdown();
}
8.2. Implementing the Output Format
BIRT already supports multiple output formats: HTML, PDF, PPT, and ODT, to name a few.
For the sample project, we implemented two of them with the methods generatePDFReport and generateHTMLReport.
They differ slightly depending on the specific properties needed, such as output format and image handlers.
In fact, PDFs embed images together with text, while HTML reports need to generate them and/or link them.
Thus, the PDF rendering function is quite straightforward:
private void generatePDFReport(IReportRunnable report, HttpServletResponse response,
  HttpServletRequest request) {
    IRunAndRenderTask runAndRenderTask = birtEngine.createRunAndRenderTask(report);
    response.setContentType(birtEngine.getMIMEType("pdf"));
    IRenderOption options = new RenderOption();
    PDFRenderOption pdfRenderOption = new PDFRenderOption(options);
    pdfRenderOption.setOutputFormat("pdf");
    runAndRenderTask.setRenderOption(pdfRenderOption);
    runAndRenderTask.getAppContext().put(EngineConstants.APPCONTEXT_PDF_RENDER_CONTEXT, request);

    try {
        pdfRenderOption.setOutputStream(response.getOutputStream());
        runAndRenderTask.run();
    } catch (Exception e) {
        throw new RuntimeException(e.getMessage(), e);
    } finally {
        runAndRenderTask.close();
    }
}
While the HTML rendering function needs more settings:
private void generateHTMLReport(IReportRunnable report, HttpServletResponse response,
  HttpServletRequest request) {
    IRunAndRenderTask runAndRenderTask = birtEngine.createRunAndRenderTask(report);
    response.setContentType(birtEngine.getMIMEType("html"));
    IRenderOption options = new RenderOption();
    HTMLRenderOption htmlOptions = new HTMLRenderOption(options);
    htmlOptions.setOutputFormat("html");
    htmlOptions.setBaseImageURL("/" + reportsPath + imagesPath);
    htmlOptions.setImageDirectory(imageFolder);
    htmlOptions.setImageHandler(htmlImageHandler);
    runAndRenderTask.setRenderOption(htmlOptions);
    runAndRenderTask.getAppContext().put(
      EngineConstants.APPCONTEXT_BIRT_VIEWER_HTTPSERVET_REQUEST, request);

    try {
        htmlOptions.setOutputStream(response.getOutputStream());
        runAndRenderTask.run();
    } catch (Exception e) {
        throw new RuntimeException(e.getMessage(), e);
    } finally {
        runAndRenderTask.close();
    }
}
Most noteworthy, we set the HTMLServerImageHandler instead of leaving the default handler. This small difference has a big impact on the generated img tag:
- the default handler links the img tag to the file system path, blocked for security by many browsers
- the HTMLServerImageHandler links to the server URL
With the setImageDirectory method, we specify where the engine will save the generated image file.
By default, the handler generates a new file at every request, so we could add a caching layer or a deletion policy.
8.3. Publishing the Images
In the HTML report case, image files are external, so they need to be accessible on the server path.
In the code above, with the setBaseImageURL method, we tell the engine what relative path should be used in the img tag link, so we need to make sure that the path is actually accessible!
For this reason, in our ReportEngineApplication, we configured Spring to publish the images folder:
@SpringBootApplication
@EnableWebMvc
public class ReportEngineApplication implements WebMvcConfigurer {
    @Value("${reports.relative.path}")
    private String reportsPath;
    @Value("${images.relative.path}")
    private String imagesPath;

    ...

    @Override
    public void addResourceHandlers(ResourceHandlerRegistry registry) {
        registry
          .addResourceHandler(reportsPath + imagesPath + "/**")
          .addResourceLocations("file:///" + System.getProperty("user.dir") + "/"
            + reportsPath + imagesPath);
    }
}
Whatever the path we choose, we have to make sure the same path is used here and in the htmlOptions of the previous snippet, or our report won’t be able to display images.
9. Displaying the Report
The last component needed to get our application ready is a Controller to return the rendered result:
@RequestMapping(method = RequestMethod.GET, value = "/report/{name}")
@ResponseBody
public void generateFullReport(HttpServletResponse response, HttpServletRequest request,
  @PathVariable("name") String name, @RequestParam("output") String output)
  throws EngineException, IOException {
    OutputType format = OutputType.from(output);
    reportService.generateMainReport(name, format, response, request);
}
With the output parameter, we can let the user choose the desired format — HTML or PDF.
10. Testing the Report
We can start the application by running the ReportEngineApplication class.
During startup, the BirtReportService class will load all the reports found in the <project_root>/reports folder.
To see our reports in action, we just need to point our browser to:
- /report/csv_data_report?output=pdf
- /report/csv_data_report?output=html
- /report/static_report?output=pdf
- /report/static_report?output=html
Here is how the csv_data_report report looks:
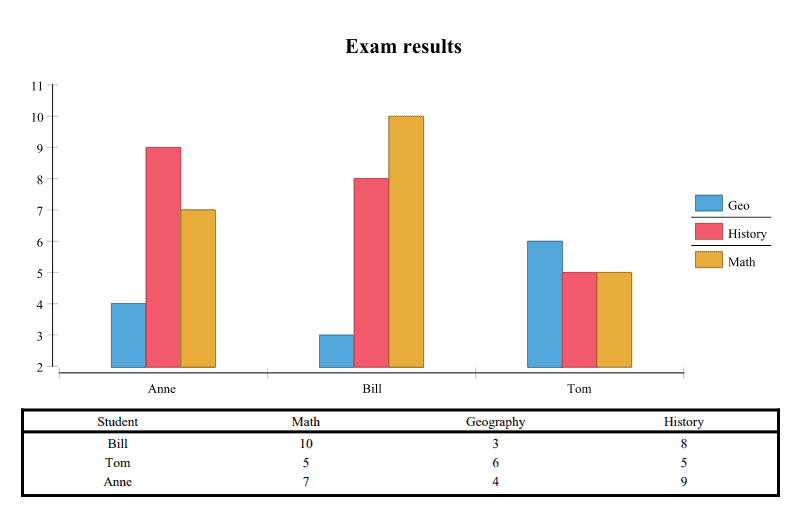
To reload a report after changing the design file, we just point our browser to /report/reload.
11. Conclusion
In this article, we integrated BIRT with Spring Boot, exploring the pitfalls and challenges, but also its power and flexibility.