1. Introduction
In this tutorial, we’ll look at Thread-Local Allocation Buffers (TLABs). We’ll see what they are, how the JVM uses them, and how we can manage them.
2. Memory Allocation in Java
Certain commands in Java will allocate memory. The most obvious is the new keyword, but there are others – for example, using reflection.
Whenever we do this, the JVM must set aside some memory for the new objects on the heap. In particular, the JVM memory allocation does all allocations in this way in the Eden, or Young, space.
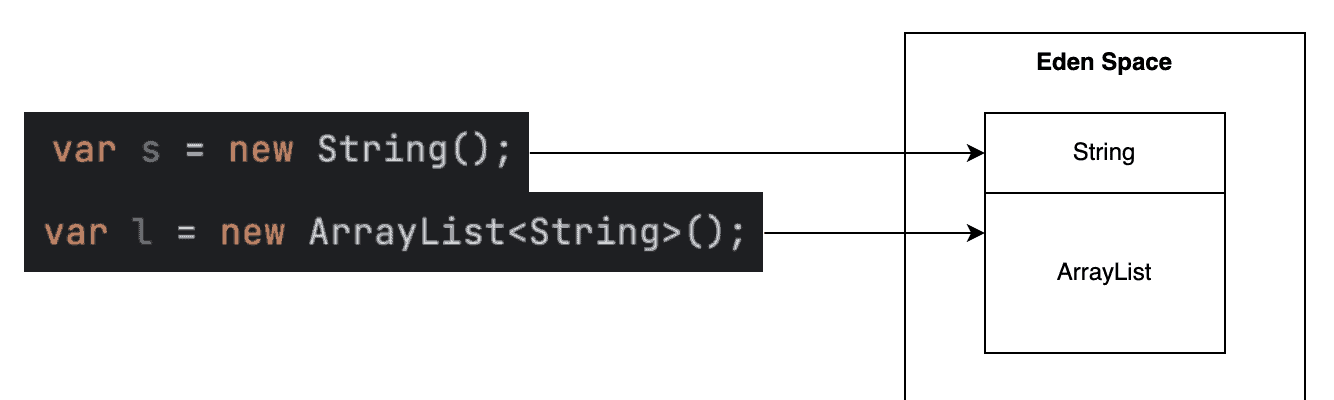
In a single-threaded application, this is easy. Since only a single memory allocation request can happen at any time, the thread can simply grab the next block of a suitable size, and we’re done:
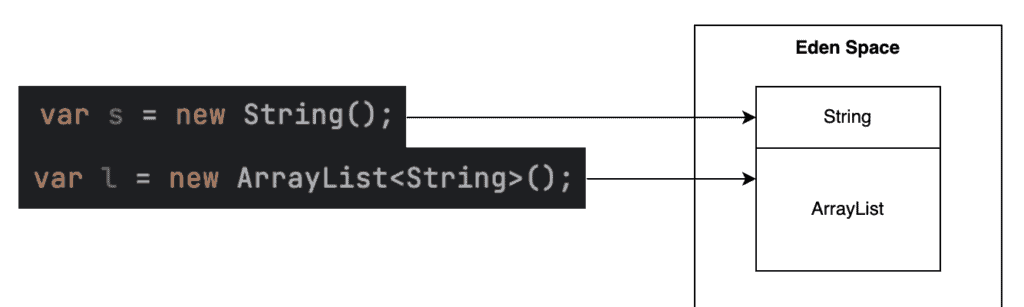
However, in a multi-threaded application, we can’t do things quite so simply. If we do, then there’s the risk that two threads will request memory at the exact same instant and will both be given the exact same block:
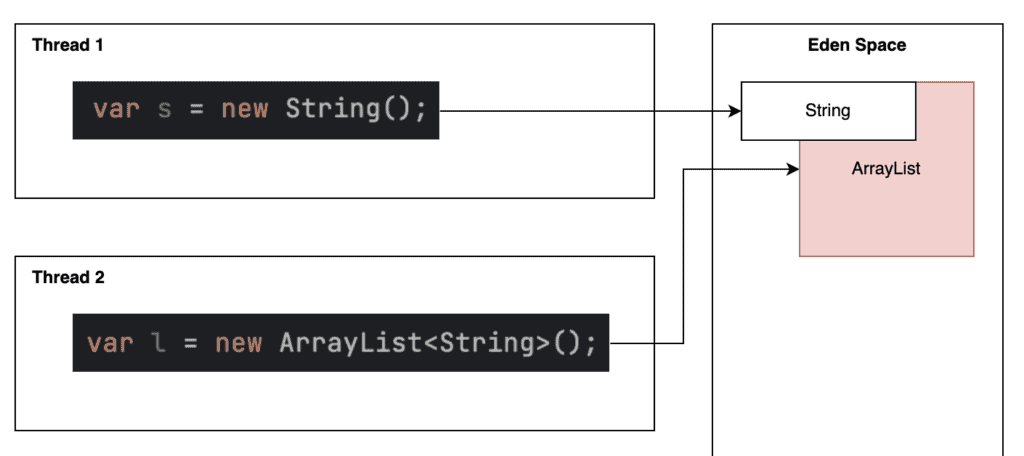
To avoid this, we synchronize memory allocations so that two threads cannot request the same memory block simultaneously. However, synchronizing all memory allocations will make them essentially single-threaded, which can be a huge bottleneck in our application.
3. Thread-Local Allocation Buffers
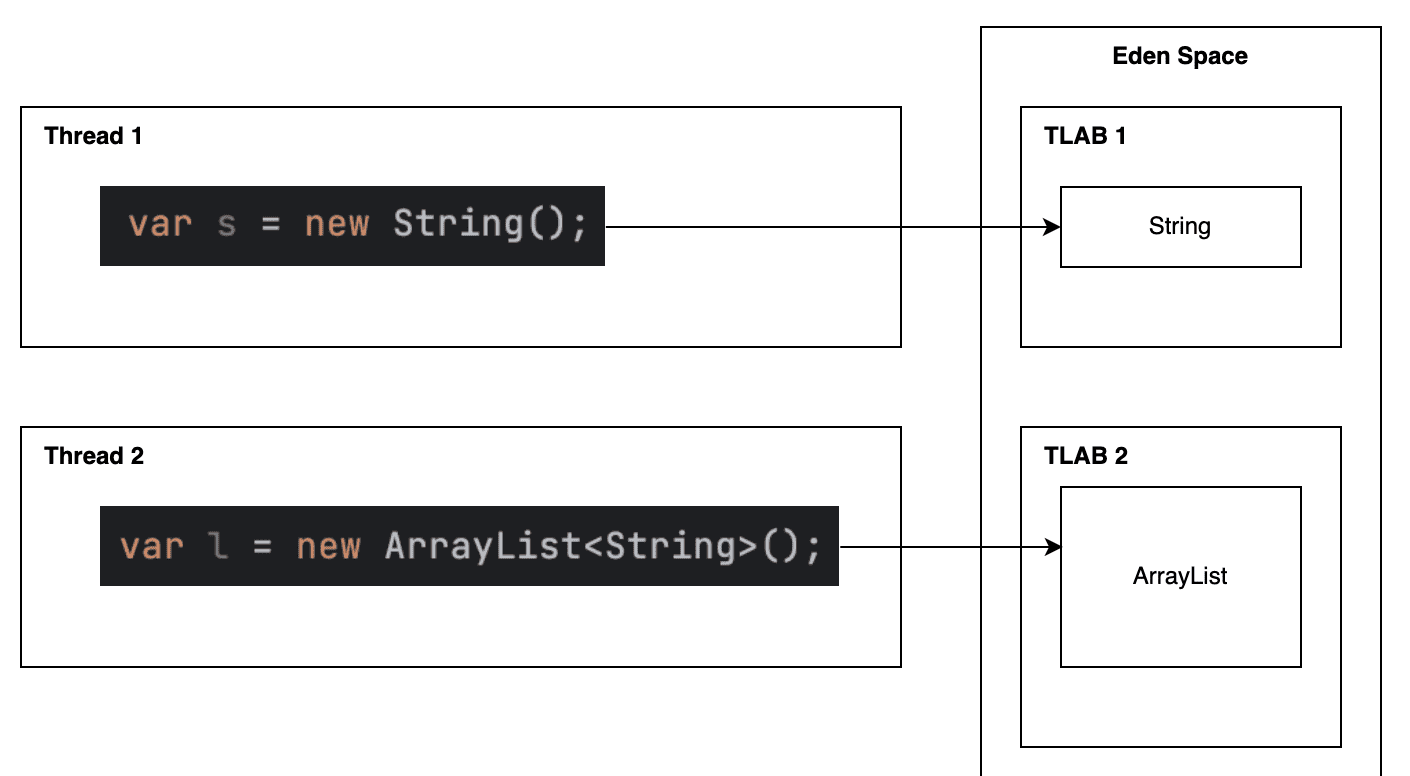
The JVM addresses this concern using Thread-Local Allocation Buffers, or TLABs. These are areas of heap memory that are reserved for a given thread and are used only by that thread to allocate memory:
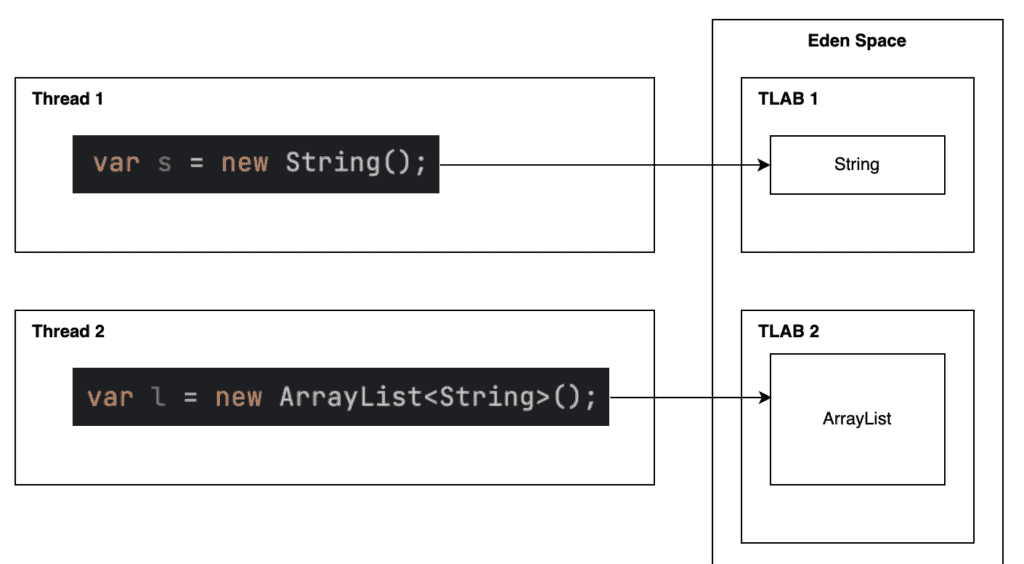
By working in this way, no synchronization is necessary since only a single thread can pull from this buffer. The buffer itself is allocated in a synchronized manner, but this is a much less frequent operation.
Since allocating memory for objects is a relatively common occurrence, this can be a huge performance improvement. But how much, exactly? We can determine this easily enough with a simple test:
@Test
public void testAllocations() {
    long start = System.currentTimeMillis();

    List<Object> objects = new ArrayList<>();

    for (int i = 0; i < 1_000_000; ++i) {
        objects.add(new Object());
    }

    Assertions.assertEquals(1_000_000, objects.size());

    long end = System.currentTimeMillis();
    System.out.println((end - start) + "ms");
}
This is a relatively simple test, but it does the job. We’re going to allocate memory for 1,000,000 new Object instances and record how long it takes. We can then run this a number of times, both with and without TLAB, and see what the average time is (We’ll see in section 5 how we can turn TLAB off.):
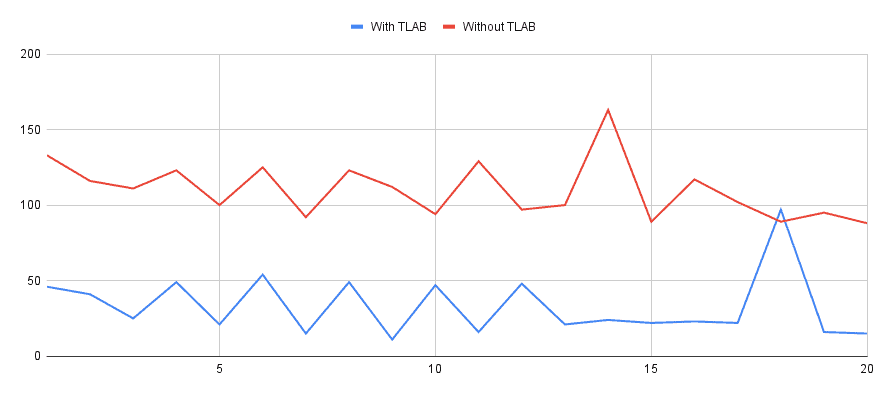
We can clearly see the difference. The average time with TLAB is 33 ms, and the average without goes up to 110 ms. That’s an increase of 230%, just by changing this one setting.
3.1. Running out of TLAB Space
Obviously, our TLAB space is finite. So, what happens when we run out?
If our application tries to allocate space for a new object and the TLAB doesn’t have enough available, the JVM has four possible options:
- It can allocate a new amount of TLAB space for this thread, effectively increasing the amount available.
- It can allocate the memory for this object from outside of TLAB space.
- It can attempt to free up some memory using the garbage collector.
- It can fail to allocate the memory and, instead, throw an error.
Option #4 is our catastrophic case, so we want to avoid it wherever possible, but it’s an option if the other cases can’t happen.
The JVM uses a number of complicated heuristics to determine which of the other options to use, and these heuristics may change between different JVMs and different versions. However, the most important details that feed into this decision include:
- The number of allocations that are likely in a period of time. If we’re likely to be allocating a lot of objects, then increasing TLAB space will be the more efficient choice. If we’re likely to be allocating very few objects, then increasing TLAB space might actually be less efficient.
- The amount of memory being requested. The more memory requested, the more expensive it’ll be to allocate this outside of the TLAB space.
- The amount of available memory. If the JVM has a lot of memory available, then increasing TLAB space is much easier than if the memory usage is very high.
- The amount of memory contention. If the JVM has a lot of threads that each need memory, then increasing TLAB space might be much more expensive than if there are very few threads.
3.2. TLAB Capacity
Using TLAB seems like a fantastic way to improve performance, but there are always costs. The synchronization needed to prevent multiple threads from allocating the same memory area makes the TLAB itself relatively expensive to allocate. We might also need to wait for sufficient memory to be available to allocate from in the first place if the JVM memory usage is especially high. As such, we ideally want to do this as infrequently as possible.
However, if a thread is allocated a larger amount of memory for its TLAB space than it needs, then this memory will just sit there unused and is essentially wasted. Worse, wasting this space makes it more difficult for other threads to obtain memory for TLAB space and can make the entire application slower overall.
As such, there’s contention about exactly how much space to allocate. Allocate too much, and we’re wasting space. But allocate too little, and we’ll spend more time than is desirable allocating TLAB space.
Thankfully the JVM will handle all of this for us, though we’ll soon see how we can tune it to our needs if necessary.
4. Seeing TLAB Usage
Now that we know what TLAB is and the impact it can have on our application, how can we see it in action?
Unfortunately, the jconsole tool doesn’t give any visibility into it as it does with the standard memory pools.
However, the JVM itself can output some diagnostic information. This uses the new unified GC logging mechanism, so we must launch the JVM with the -Xlog:gc+tlab=trace flag to see this information. This will then periodically print out information about the current TLAB usage by the JVM. For example, during a GC run, we might see something like:
[0.343s][trace][gc,tlab] GC(0) TLAB: gc thread: 0x000000014000a600 [id: 10499] desired_size: 450KB slow allocs: 4 refill waste: 7208B alloc: 0.99999 22528KB refills: 42 waste 1.4% gc: 161384B slow: 59152B
This tells us that, for this particular thread:
- The current TLAB size is 450 KB (desired_size).
- There have been four allocations outside of TLAB since the last GV (slow allocs).
Note that the exact logging will vary between JVMs and versions.
5. Tuning TLAB Settings
We’ve already seen what the impact can be from turning TLAB on and off, but what else can we do with it? There are a number of settings that we can adjust by providing JVM parameters when starting our application.
First, let’s actually see how to turn it off. This is done by passing the JVM parameter -XX-UseTLAB. Setting this will stop the JVM from using TLAB and force it to use synchronization on every memory allocation.
We can also leave TLAB enabled but stop it from being resized by setting the JVM parameter -XX:-ResizeTLAB. Doing this will mean that if the TLAB for a given thread fills up, all future allocations will be outside TLAB and require synchronization.
We also have the ability to configure the size of TLAB. We can provide the JVM parameter -XX:TLABSize with a value to use. This defines the suggested initial size that the JVM should use for each TLAB, so it’s the size per thread to allocate. If this is set to 0 – which is the default – then the JVM will dynamically determine how much to allocate per thread based on the current state of the JVM.
We can also specify -XX:MinTLABSize to give a lower limit on what the TLAB size for each thread should be for cases where we’re allowing the JVM to dynamically determine the size. We also have -XX:MaxTLABSize as the upper limit on what the TLAB can grow to for each thread.
All of these settings have sensible defaults already, and it’s usually best to just use these, but if we find there are problems, we do have a level of control.
6. Summary
In this article, we’ve seen what Thread-Local Allocation Buffers are, how they’re used, and how we can manage them. Next time you have any performance issues with your application, consider if this could be something to investigate.