1. Overview
Apache JMeter is an open-source Java-based application designed to analyze and measure the performance of web applications. It’s basically an application that we can use to test and analyze the overall performance of a server under different load conditions.
JMeter provides an easy-to-use GUI that we can use to define, execute, and view reports for various load tests. It also supports a non-GUI mode where we can run scripts via the command-line interface.
In this tutorial, we’ll learn how to run JMeter JMX files from the command line while configuring the report file.
2. Setup
Before we begin, let’s set up a JMeter script that we’ll use throughout our demonstration. For mocking some APIs, we’ll use sample REST endpoints provided by https://postman-echo.com.
Firstly, we’ll create a Test Plan in JMeter with a Thread Group. Secondly, we’ll add an HTTP Request sampler to our Thread Group that uses the mock endpoint provided by the Postman echo service. Finally, we’ll add a Summary Report to our Thread Group that generates a summary for our test run.
Let’s look at each of these steps in detail.
2.1. Create a JMeter Test Plan and Thread Group
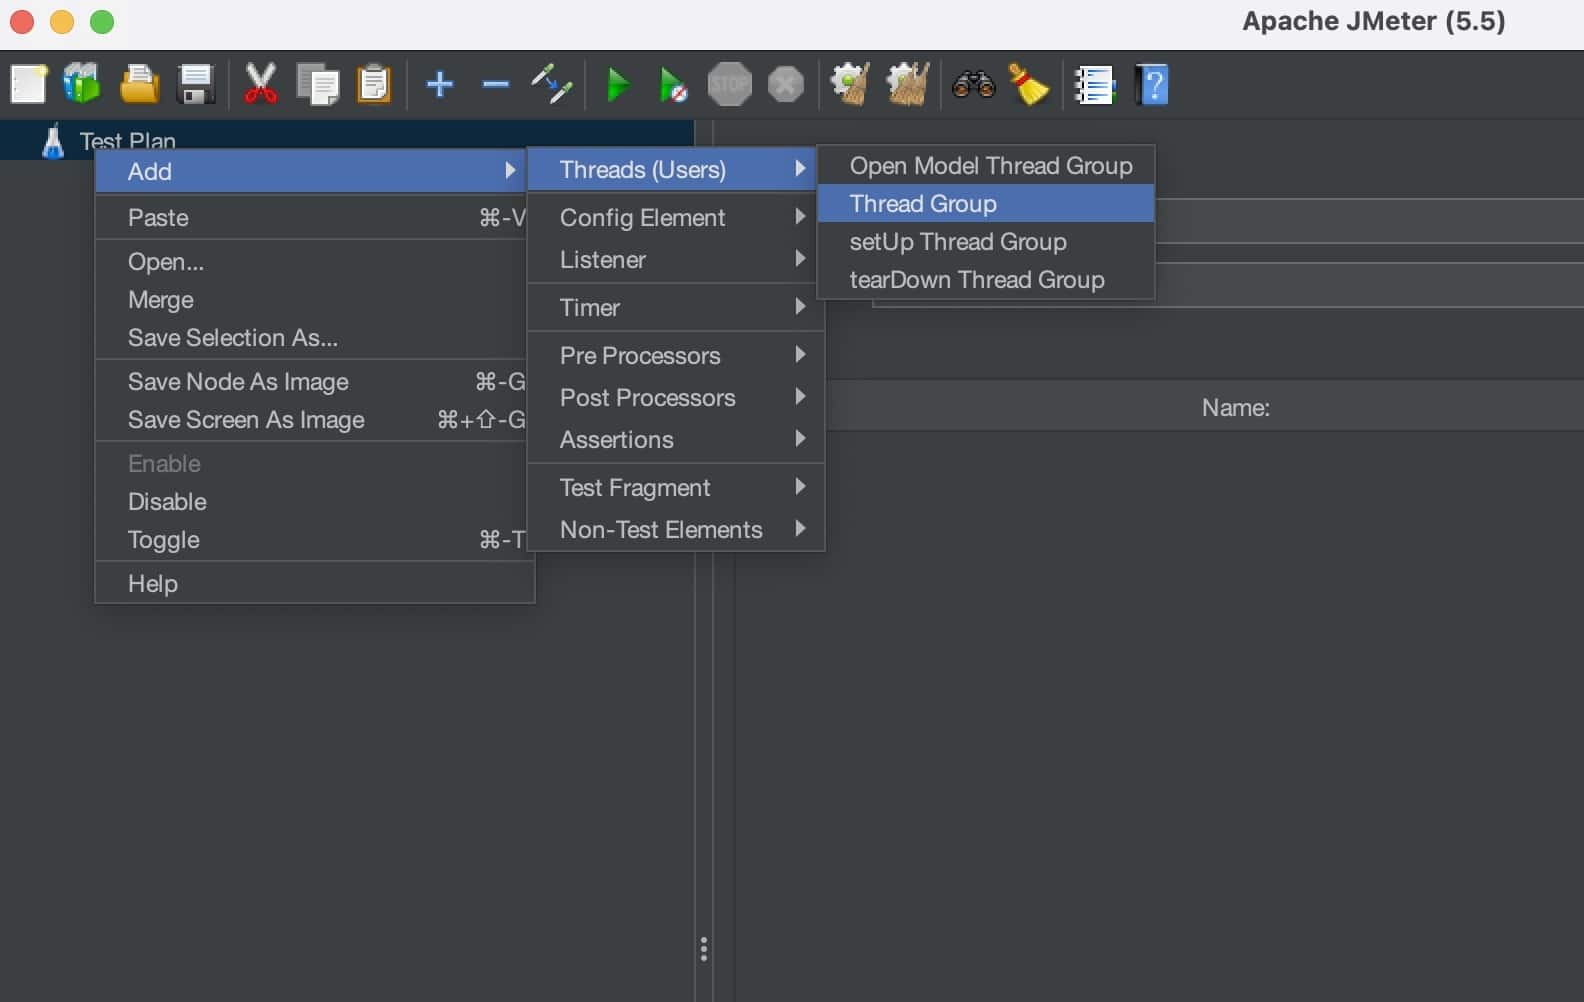
We’ll use the JMeter GUI to set up our Test Plan. First, let’s add a Thread Group to our Test Plan:
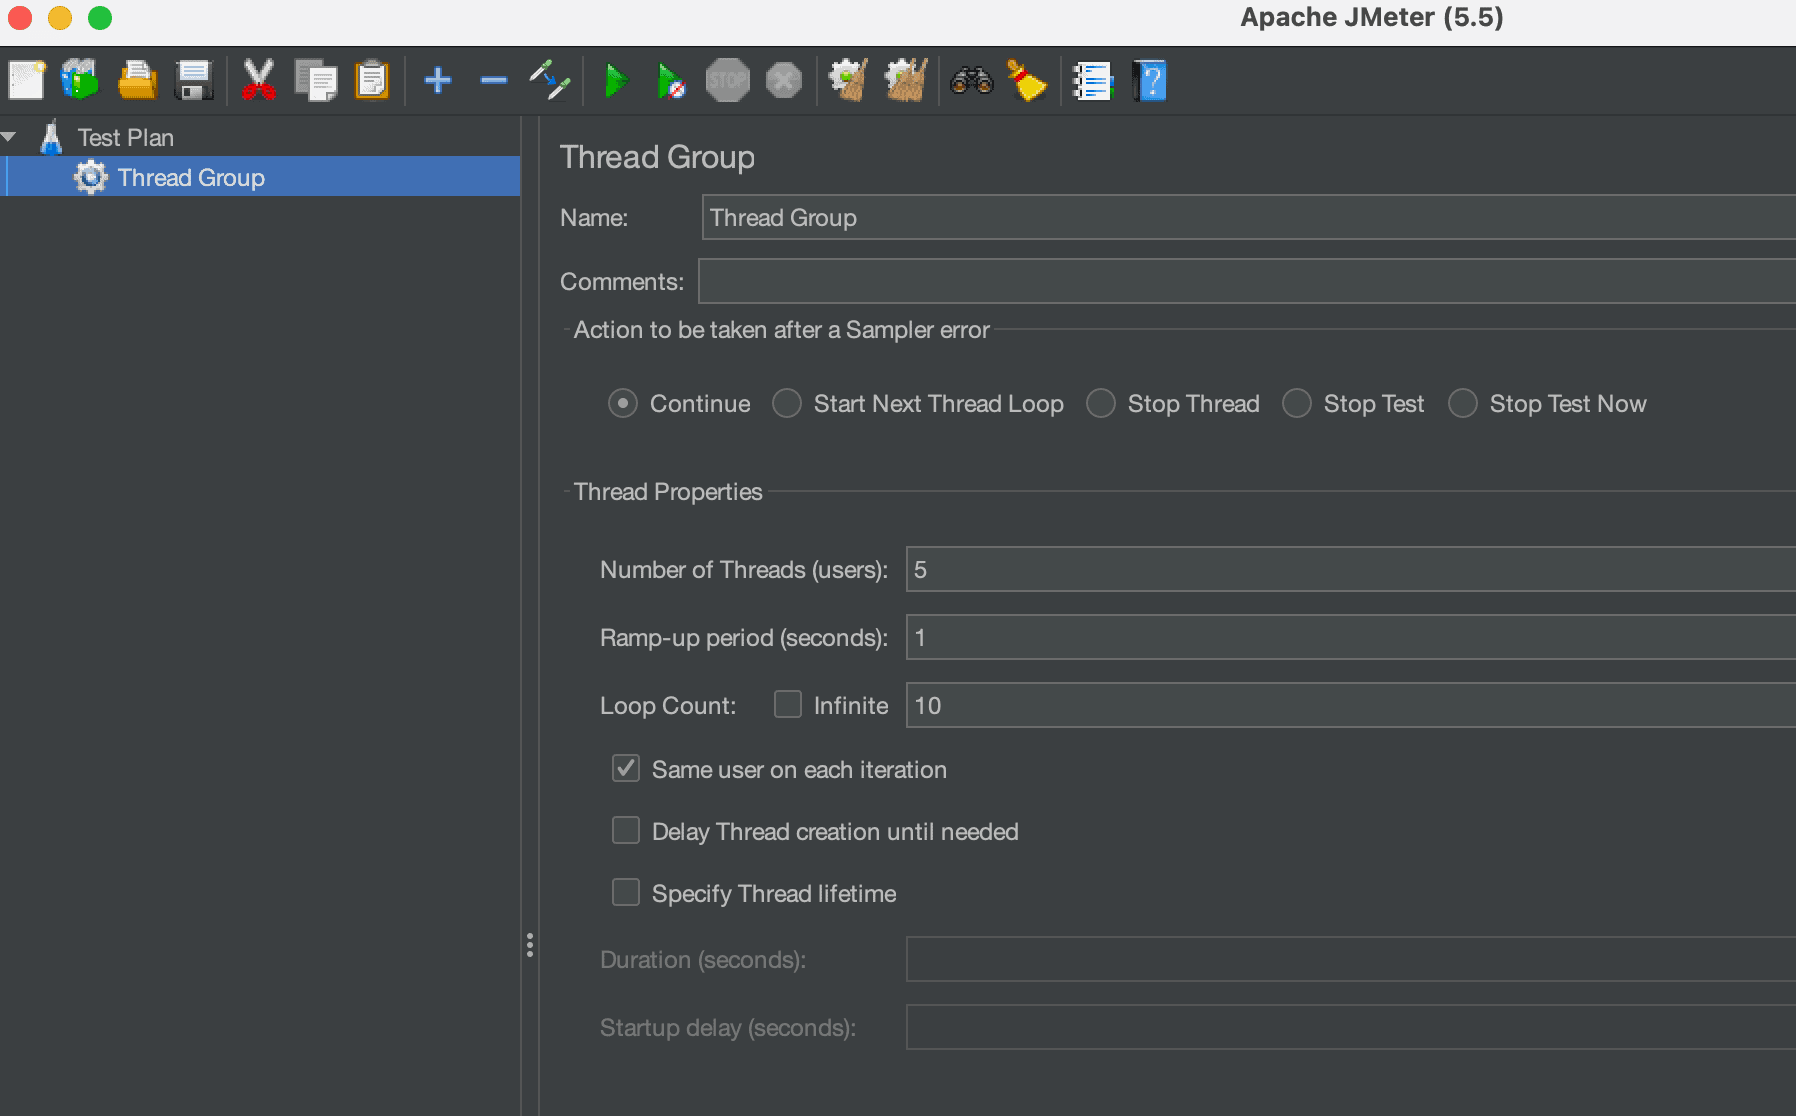
Further, let’s configure the thread group to use five threads having a ramp-up period of one second with a loop count of 10:
2.2. Configuring HTTP Request Sampler
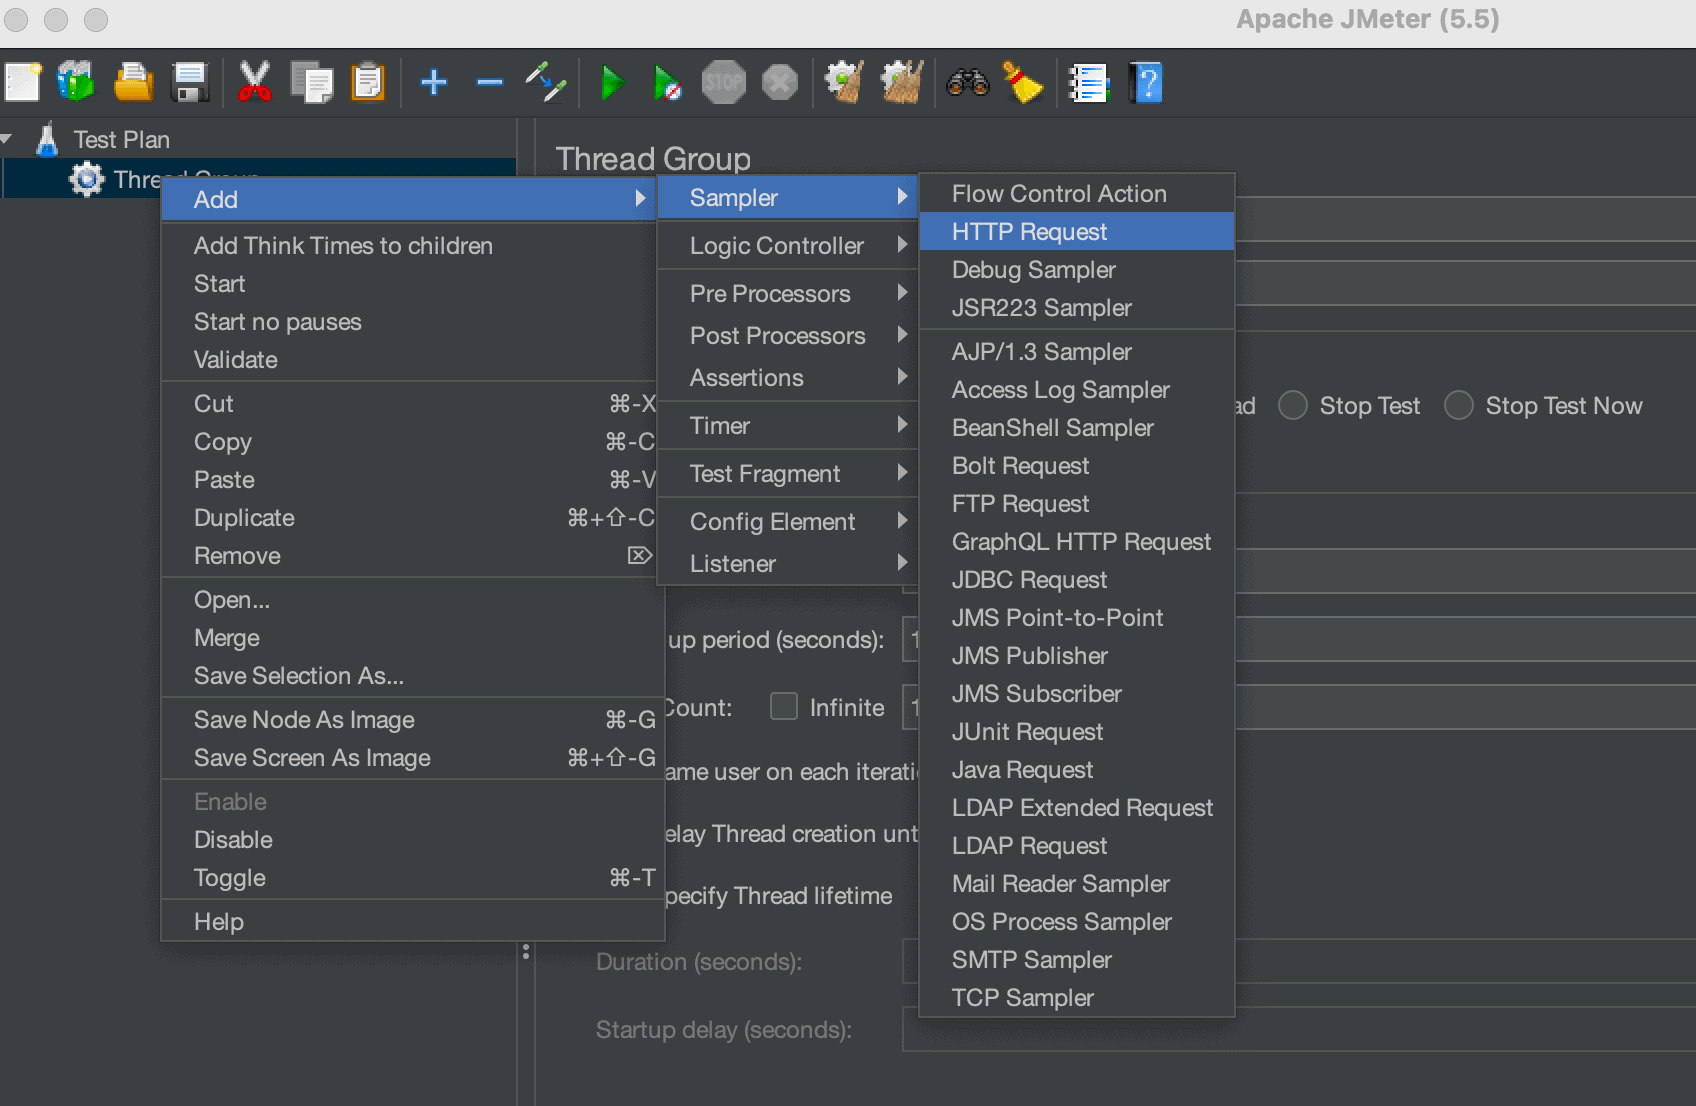
Now, let’s create an HTTP Request Sampler within this Thread Group:
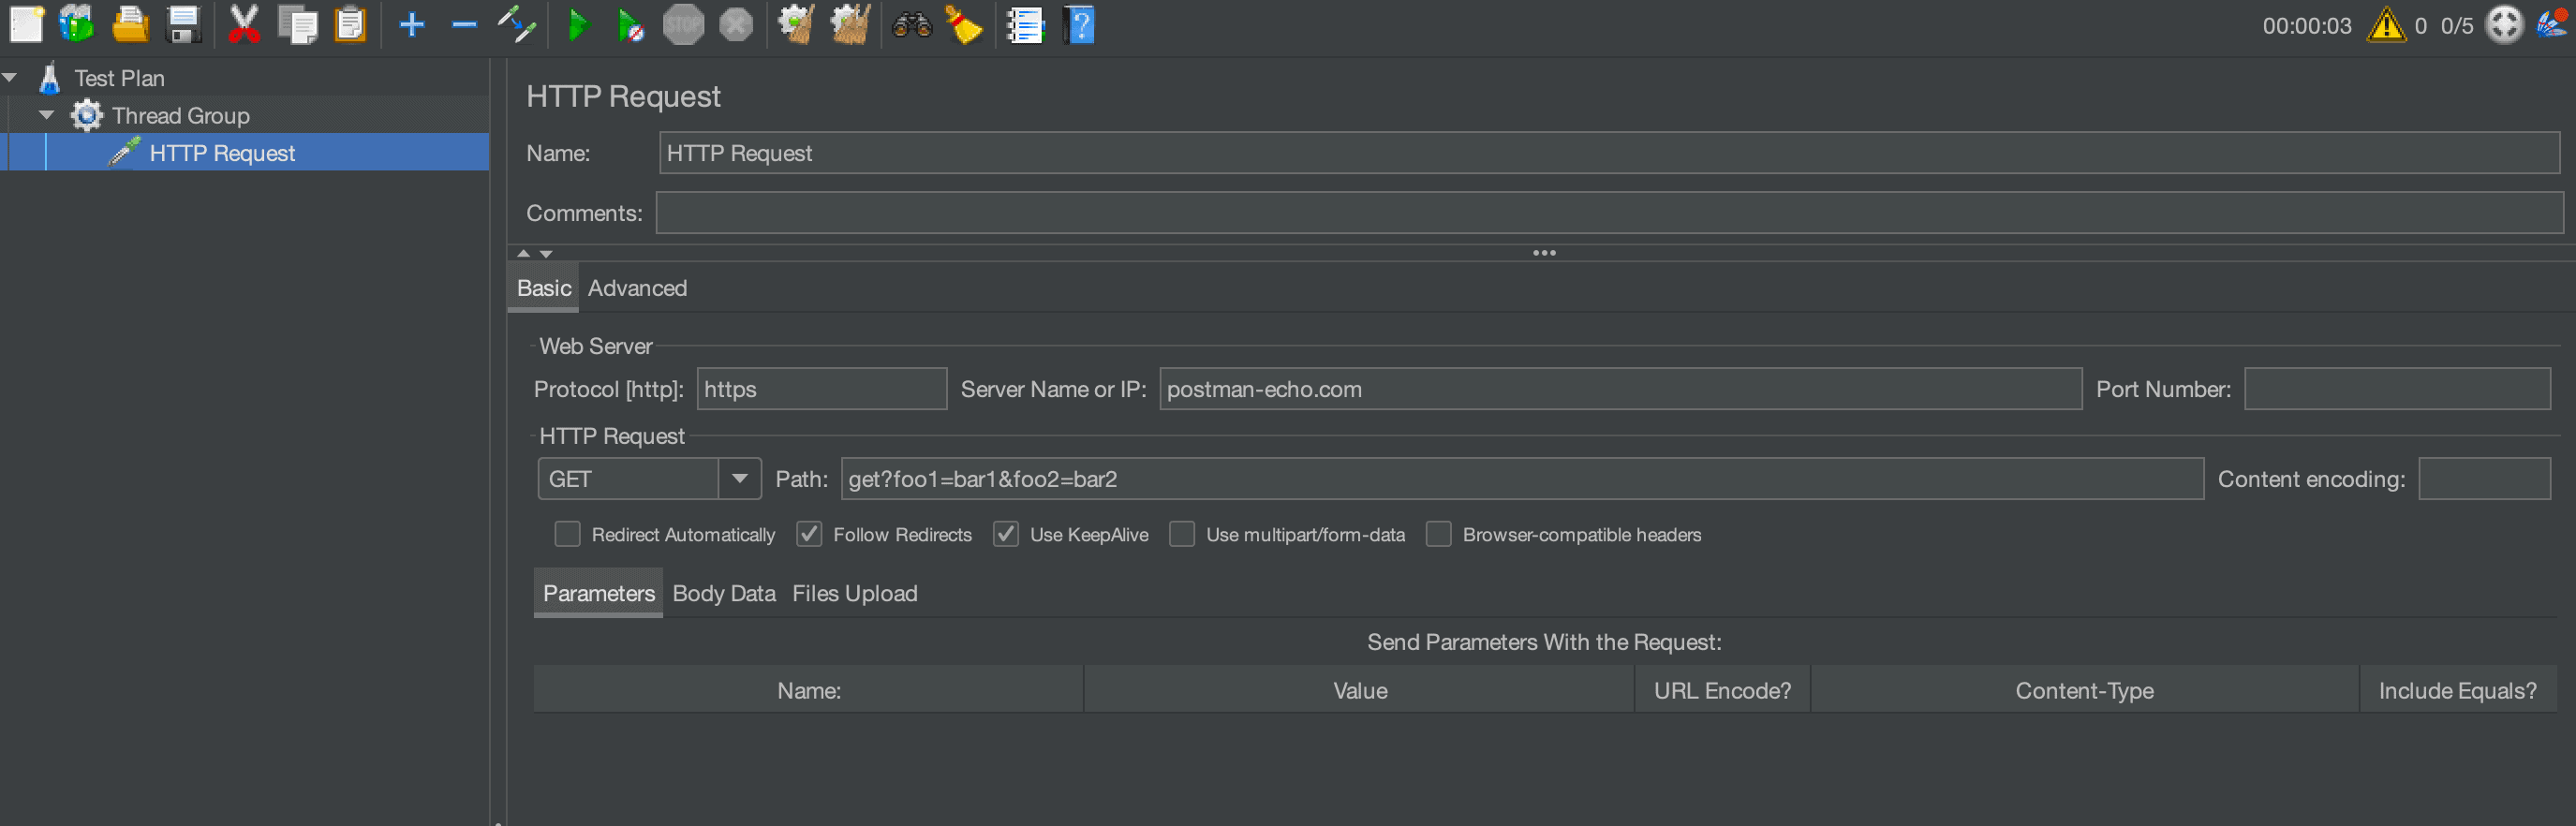
Let’s configure the HTTP Sampler to use the GET endpoint provided by the Postman echo service:
2.3. Configuring Summary Report Listener
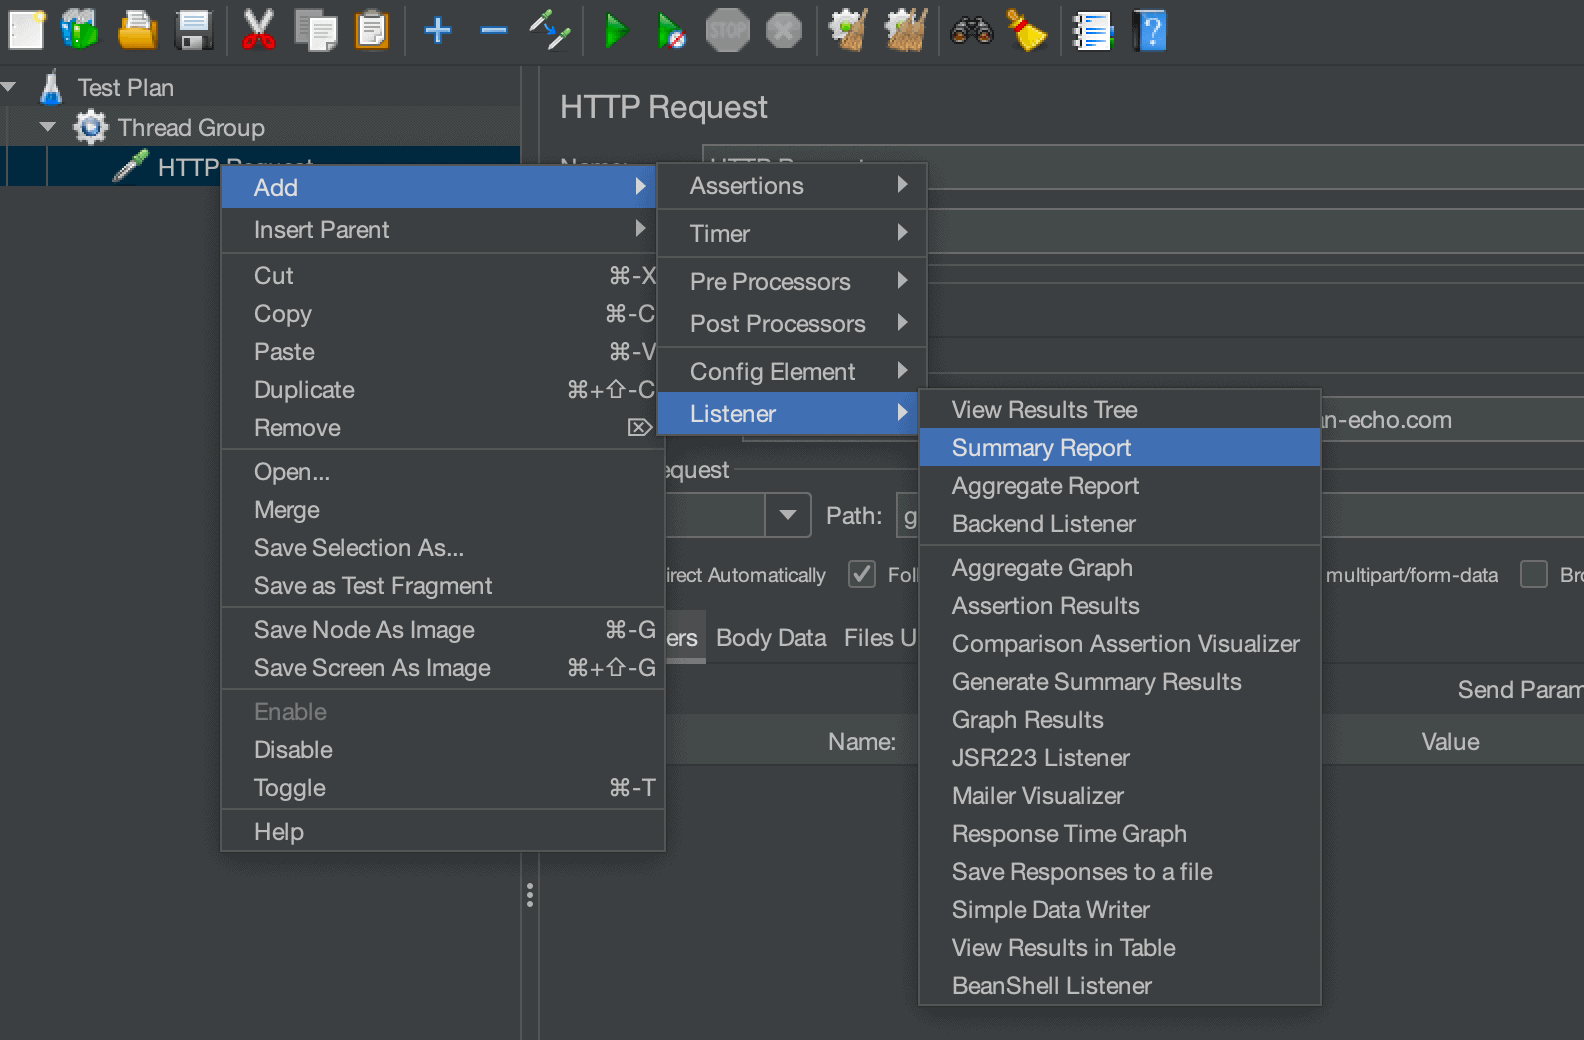
Finally, let’s add a Summary Report listener to our Thread Group that summarises the results of our test plan:
With this, we have our basic JMeter script ready. Let’s run this in the GUI and take a look at the generated Summary Report:
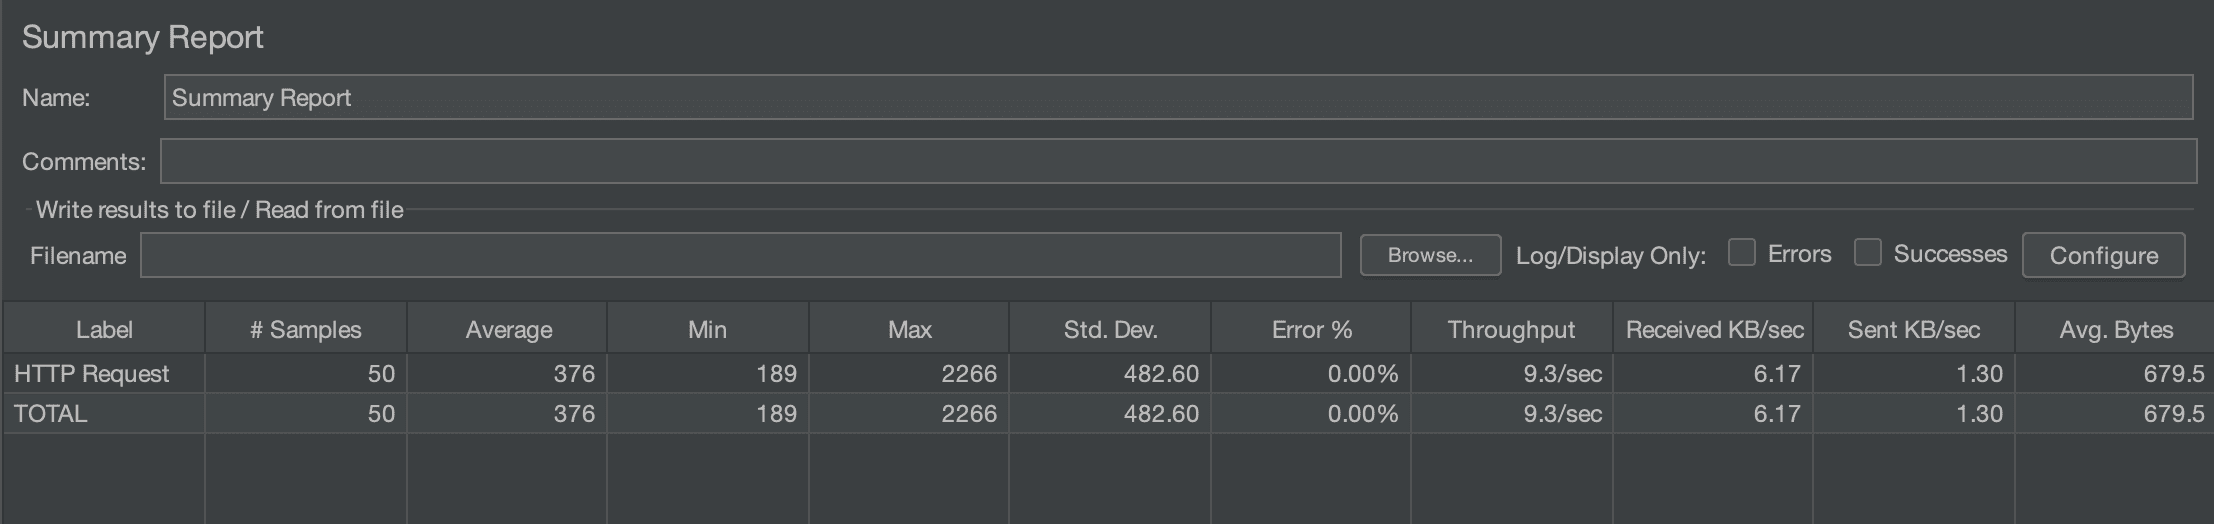
Evidently, on running the JMeter script, we are able to successfully generate a summary report for our test configuration. We’ll save this as “Summary-Report.jmx” and use it to run tests from the command line.
3. Running JMeter .jmx File From the Command Line
Until now, we have a sample JMX file with a Test Plan that’s configured to run a test having a sample mock API.
As already mentioned, JMeter JMX files can be run in the non-GUI mode using the command-line interface. We use the jmeter command with options to run a JMeter script file from the CLI. This command can be run by changing directories into the bin directory within the JMeter installation path.
Let’s have a look at the CLI command to run our “Summary-Report.jmx” file and generate test reports:
$ jmeter -n -t Summary-Report.jmx -l Summary-Report.jtl
Running the above command produces the following output on the CLI:
Creating summariser <summary>
Created the tree successfully using /Users/baeldung/Summary-Report.jmx
Starting standalone test @ 2023 Jun 3 13:32:11 IST (1685779331706)
Waiting for possible Shutdown/StopTestNow/HeapDump/ThreadDump message on port 4445
summary =     50 in 00:00:08 =    6.6/s Avg:   499 Min:   193 Max:  3601 Err:     0 (0.00%)
Tidying up ...    @ 2023 Jun 3 13:32:19 IST (1685779339273)
... end of run
The command basically runs our test file “Summary-Report.jmx” and generates a summary report in the “Summary-Report.jtl” file.
JMeter CLI provides multiple options in order to configure the way the script is run. We use these parameters to override the ones set in the JMX file. Let’s look at some of the options we used in our script:
- -n: specifies that JMeter is to run in a non-GUI mode
- -t: specifies the location of the JMX file that includes the Test Plan
- -l: specifies the location of the JTL (JMeter Test Logs) file
Further, let’s take a look at the first few lines from the contents of the “Summary-Report.jtl” file:
timeStamp,elapsed,label,responseCode,responseMessage,threadName,dataType,success,failureMessage,bytes,sentBytes,grpThreads,allThreads,URL,Latency,IdleTime,Connect
1685779331808,978,HTTP Request,200,OK,Thread Group 1-1,text,true,,681,143,5,5,https://postman-echo.com/get?foo1=bar1&foo2=bar2,974,0,780
1685779331959,827,HTTP Request,200,OK,Thread Group 1-2,text,true,,679,143,5,5,https://postman-echo.com/get?foo1=bar1&foo2=bar2,823,0,625
1685779332163,786,HTTP Request,200,OK,Thread Group 1-3,text,true,,681,143,5,5,https://postman-echo.com/get?foo1=bar1&foo2=bar2,785,0,589
1685779332787,194,HTTP Request,200,OK,Thread Group 1-2,text,true,,681,143,5,5,https://postman-echo.com/get?foo1=bar1&foo2=bar2,194,0,0
We can see that the generated JTL file contains details of each API request in a CSV format.
4. Configuring JMeter Summary Report
We can customize the parameters displayed in the summary report along with their formatting options. There are two ways to customize the summary report:
- Updating the JMeter properties
- Passing parameters as command line options
Let’s take a look at each of these methods in detail.
4.1. Configuring the JMeter Properties
The JMeter properties file “jmeter.properties” is located inside the bin directory within the JMeter’s installation directory. The summary report-related properties in the properties file start with the “jmeter.save.saveservice.” prefix:
#jmeter.save.saveservice.output_format=csv
#jmeter.save.saveservice.response_code=true
#jmeter.save.saveservice.latency=true
By default, these properties are commented, and we can uncomment them to set their values. Let’s uncomment a few properties and update their values:
jmeter.save.saveservice.response_code=false
jmeter.save.saveservice.latency=false
jmeter.save.saveservice.output_format=xml
Rerunning the JMeter script now generates the following results:
<?xml version="1.0" encoding="UTF-8"?>
<testResults version="1.2">
<httpSample t="801" it="0" ct="593" ts="1685791090172" s="true" lb="HTTP Request" rm="OK" tn="Thread Group 1-3" dt="text" by="679" sby="143" ng="5" na="5">
<java.net.URL>https://postman-echo.com/get?foo1=bar1&foo2=bar2</java.net.URL>
</httpSample>
<httpSample t="1004" it="0" ct="782" ts="1685791089969" s="true" lb="HTTP Request" rm="OK" tn="Thread Group 1-2" dt="text" by="679" sby="143" ng="5" na="5">
<java.net.URL>https://postman-echo.com/get?foo1=bar1&foo2=bar2</java.net.URL>
</httpSample>
</testResults>
The output format is now in an XML form, as can be seen from the result. Moreover, we observe that the response code and latency fields are now not produced in the output.
4.2. JMeter Properties as CLI Options
We can override the properties set in the “jmeter.properties” file by passing them as options via the command line:
$ jmeter -Jjmeter.save.saveservice.output_format=csv -n -t Summary-Report.jmx -l Summary-Report.jtl
Here, we use the -J option to pass and override any existing JMeter properties while running the test script.
The command now generates the following result:
timeStamp,elapsed,label,responseMessage,threadName,dataType,success,failureMessage,bytes,sentBytes,grpThreads,allThreads,URL,IdleTime,Connect
1685792003144,961,HTTP Request,OK,Thread Group 1-1,text,true,,685,143,5,5,https://postman-echo.com/get?foo1=bar1&foo2=bar2,0,741
1685792003306,799,HTTP Request,OK,Thread Group 1-2,text,true,,681,143,5,5,https://postman-echo.com/get?foo1=bar1&foo2=bar2,0,599
1685792004106,200,HTTP Request,OK,Thread Group 1-2,text,true,,681,143,5,5,https://postman-echo.com/get?foo1=bar1&foo2=bar2,0,0
Hence, we’ve successfully overridden the output format from XML to CSV by passing the parameter as a CLI option.
5. Conclusion
In this article, we’ve learned how to run a JMeter JMX file from the command line and configure the summary report file.
Firstly, we looked at how to use the jmeter command along with some of its options to run a JMX file. We then saw how we could configure the summary report by configuring the properties in the jmeter.properties file. Lastly, we discussed how we could override these properties by passing them as options via the command line.
As always, the JMeter scripts for all our examples are available over on GitHub.